Relative influence of family and school factors on student cognitive achievement:
A Brazilian Experience
Soares, J. F.; César, C. C.; Mambrini, J.
Federal University of Minas Gerais - Brazil
jfsoares@est.ufmg.br, cibele@est.ufmg.br, juliana@est.ufmg.br
INTRODUCTION
Since around 1990, five major trends have characterized Brazilian Federal Government actions on the basic education system: (1) decentralization towards municipalities, (2) greater autonomy for the schools, (3) changes in financial mechanisms, (4) curriculum revisions and (5) distribution of textbooks to large population of students.
The impact of these public educational policies has been assessed by the Brazilian Evaluation System of Basic Education (SAEB, in Portuguese). SAEB is primarily an evaluation tool, established to measure the cognitive achievement of students. Having gone through five testing and measurement cycles (1991, 1993, 1995, 1997, 1999) is now firmly established. It comprises tests of Portuguese grammar and writing, Mathematics and Science. Results show low-level of performance for all Brazilian students with very large differences in achievement by geographic region and by socioeconomic status.
As recent evaluations have reported (Crespo et al., 1999) schools have used SAEB mainly for comparisons among groups of students rather than for program or policy improvement. SAEB can be used to find which internal school policies have to be changed in order to improve student performance. Unfortunately the SAEB data has not been analyzed with this purpose in mind. This is the object of a large ongoing project aimed at reanalyzing, with schools in mind, the 1995 and 1997 SAEB data. The main objective is to identify school factors associated with good student performance. These factors will be further studied through qualitative work. The factors with theoretical and empirical consistency would be recommended to Brazilian schools for use in their improvement efforts. This paper reports the first results of this project.
In response to the findings of the Coleman report, researchers e.g. Rutter et al. (1979) conducted several studies which show that the outcome of schooling are not totally determined by the students characteristics. In Brazil, for ideological reasons, this position was taken to a extreme. Several authors, e.g. Arroyo et al. (1986), suggested that only school factors would have to be considered in order to improve student achievement. They often use the term "school failure" to stress their point. This position, however, was taken without the support of empirical data, which, on the country level, have become available only after the beginning of the SAEB project. Today it is possible to produce a more balanced view of the relative importance of family and school factors. The new empirical evidence and the theoretical advances made in recent years in the area of school effectiveness should prove useful for the pedagogic planning of Brazilian schools. Another objective of this paper is to contribute to this debate.
DATA
The SAEB target population is the students attending the 4th and 8th grade of the basic education and the 3rd grade of the medium school. The program aimed to evaluate the students in Language, Mathematics and Science. Each child in the sample was evaluated in only in one subject. Although SAEB collected data in all the Brazilian states, three states (Federal District, Goiás and Mato Grosso) had to be excluded from this analysis due to missing information on the students characteristics. Also the results in this paper comprised only the 8th grade students that took the mathematics test. The sample size was 16124 students from 689 schools. Table 1 presents the sample size within each state.
Table 1: Distribution of the sample within the states
|
State |
Number of schools |
Number of students |
State |
Number of schools |
Number of students |
|
|
Acre |
34 |
589 |
Paraná |
23 |
651 |
|
|
Alagoas |
25 |
710 |
Pernambuco |
23 |
528 |
|
|
Amapá |
28 |
544 |
Piauí |
24 |
575 |
|
|
Amazonas |
30 |
784 |
Rio de Janeiro |
29 |
769 |
|
|
Bahia |
29 |
808 |
Rio Grande do Norte |
30 |
648 |
|
|
Ceará |
33 |
731 |
Rio Grande do Sul |
20 |
617 |
|
|
Espírito Santo |
30 |
871 |
Rondônia |
44 |
748 |
|
|
Maranhão |
21 |
645 |
Roraima |
34 |
546 |
|
|
Mato Grosso do Sul |
19 |
437 |
Santa Catarina |
18 |
522 |
|
|
Minas Gerais |
29 |
614 |
São Paulo |
32 |
828 |
|
|
Pará |
31 |
961 |
Sergipe |
31 |
599 |
|
|
Paraíba |
32 |
741 |
Tocantins |
40 |
658 |
|
|
TOTAL: 689 school and 16124 students |
||||||
Together with cognitive achievement data, SAEB collects data on the student and the respective family; also on the school attended, including its principal and teachers. In order to use this data for the construction of cognitive achievement explicative model, we had to construct measure for the explicative factors using the questionnaires items. The basic tool to accomplish this was Samejima (1969) latent trait measurement models. The use of this methodology, instead of Likert type scaling, was based on the belief that the assumption underneath the latter methodology, i.e., that all items have the same influence on the factor, was not reasonable for the SAEB data.
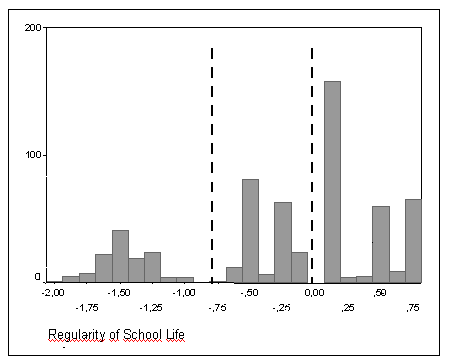
Figure 1 present the histogram for the measure of the factor called " Regularity of student school live". There seems to exist only three groups of students, not a continuum of them. Since this is a fairly typical result, for most factors, we decided not to work with the measurement of the factor, obtained by IRT model, but with dummy variables representing the different groups.
Figure 1: Histogram of the Student Factor Regularity of School Life
Using this approach, for the student we constructed factors capturing the family structure, and its cultural and socioeconomic status, regularity of student school live, student and family attitude toward school and perception of teacher’s level of engagement. For the principal, besides such socio-demographic variables as age, sex and salary, we constructed factors describing the principal’s training on school administration, administrative leadership, pedagogic leadership, and relation with students’ families. For the school we were able to measure the following factors: physical conditions, existence of pedagogic equipment, affiliation (private/state), city or rural, and school climate as perceived by teachers. Finally, on the teacher, besides the socio-demographic variables, we constructed factors describing professional experience, quality of class activities used, expectations of student achievement and quality of relation with student family.
STATISTICAL MODELING
Variable Selection
The model building strategy began by selecting, based on theoretical and empirical considerations, among the many factors measured the ones associated with better student achievement. This was done though preliminary regression modeling using ordinary least squares and only the data from the State of Minas Gerais. For social and economic reasons, this State can be taken as a synthesis of Brazil.
The factors measuring school processes, i.e., all the ones computed using items from the school, teacher and principal questionnaires, did not shown either enough association with the student achievement or were too correlated with a single variable called SECTOR, with capture whether the school is public or private. This can be noting that the SAEB questionnaires were not developed to allow the measure of explicative factors and the fit of statistical models. We constructed measure for the factors, a posteriori, using the available items, often not the appropriate ones. This is special true for school process variables as school climate, principal leadership, teacher- student relationship, which from the literature, e.g. Scheerens (1992), we expect to be significant but in our study didn't show statistical significance.
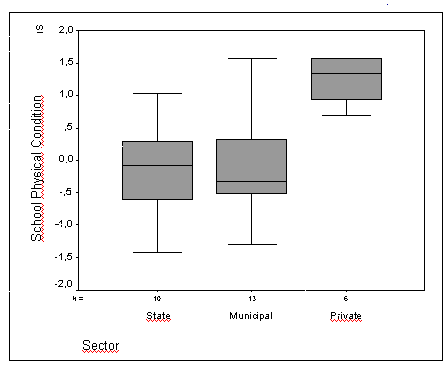
Figure 2 show the box-plot of school physical conditions discriminated by SECTOR. We observe two almost non overlapping blocks of school. In words we see State and Municipal schools with very unfavorable conditions, while private schools with much better conditions. A behavior very similar to this one holds for several other school factors, explaining why those factors were not included in the final models.
Figure 2 : Relationship between School Sector and School Physical Conditions
The factors included in the final model are described in Table 2.
Table 2: Factors Included in the Final Model
|
Dimension |
Factor |
Description |
Level of measurement |
|
STUDENT |
SEX |
Student Sex |
Dummy variable: 0= Female 1=Male |
|
TEST |
Opinion about the test |
Ordinal scale |
|
|
SES |
Socioeconomic status |
Samejima scale |
|
|
REGULAR |
Regularity of School Life |
Dummy variable after Samejima scaling |
|
|
SCHOOL |
SECTOR |
Affiliation (Public/Private) |
Dummy variable: 0=Public 1=Private |
In Table 2 the variable TEST measure, in a 5-point scale, the student's opinion on how easy h/she considered the test. The variable SES is a composite index of the educational level of both parents and whether they were or not working at the moment of the test. The variable REGULAR is measured through a Samejima scaling, wich includes the age each student entered school, whether h/she has withdrawn from school during their school life and whether or h/she has repeated a grade. After the initial analysis this variable was transformed into a dummy variable.
HLM models
SAEB used a three-stage cluster design to collect data, in each strata defined by the Brazilian States. In stage 1 schools are selected; in stage 2, classes within the chosen schools, are selected and finally in stage 3 students, within the selected classes, are sampled. Such clustered data tend to exhibit within-cluster (also called intracluster) correlation, i.e. , the outcomes of units belonging to the same cluster tend to be more similar than the outcomes of units from different clusters.
Since an important assumption underlying standard regression techniques is the independence between the observations, the use of these standard models on clustered data can produce unreliable results. Therefore the final analyses in the paper use hierarchical linear models, (Bryk and Raudenbush, 1992) that take the intracluster correlation into consideration.
Although we had, at the beginning of the analysis, three levels of observations – students, classes and schools- the great majority of schools had just one class included. This forced us to consider only two levels: students and school. Later the States were included as the third level.
The statistical analysis consists in fitting three different models. The first model is a fully unconditional one, i.e, no explicative variable is included at any level. Such model, represented by equation 1 give information on the outcome variability at each of the three levels: e ijk for the students, u0jk for the school and r0k0 for the states.
Model 1: Yijk=l 000+e ijk+u0jk+r0k0 (1)
Model 2, a conditional model, added the students’ factors to Model 1. Its equation is:
Model 2:Yijk=l 000+l 100SEX+l 200TEST+l 300REGULAR+l 400SES+e ijk+u0jk+r0k0 (2)
Model 3, also a conditional model, included all the explicative variables of Model 2 plus the level 2 dummy variable for SECTOR..
Equations 3.a to 3.d identify Model 3, using the factors' code presented in table 2 and the standard notation for hierarchical linear model.
Yijk = b 0jk + b 1(SEX) + b 2(TEST) +b 3(REGULAR) + b 4(SES) + e ijk (3.a)
b
0jk = g 00k + g 01k(SECTOR) + u0jk (3.b)g
00k = l 000 + r0k0 (3.c)In just one equation model 3 can be presented as:
Yijk=l 000+l 010SECTOR+l 100SEX+l 200TEST+l 300REGULAR+l 400SES+e ijk+u0jk+r0k0 (3.d)
This model assumes that part of the variability between students, within the same school, is explained by the students’ factors and part of variability between schools, is explained by schools’ affiliation. All efffects are taken in an additive form, i.e. no interaction between factors. In other words, school factors explained differences in schools’ means but they did not modify level 1 effects. Some variability remained unexplained in each one of these levels, after controling by level 1 and level 2 factors and they were represented by the error terms e ij e uj.
There are differences on student’s achievement in Mathematics among the different Brazilian States, which captured by the error terms represented rk0, in equation (3.c) We did not try to explain this variability by state specific variables. In another words we assume models with three random components: between students, between schools and between states.
RESULTS
Tables 3 to 5 present the results of the fitting.
Table 3: Results of the Hierarchical Liner Model 1
|
|
Estimate |
SD |
P value |
|
Fixed Effects |
|
|
|
|
Intercept |
254.3115 |
2.6710 |
0.000 |
|
|
Variability |
Percent of Total |
P value |
|
Random Effect |
|
|
|
|
Unexplained Variance |
2523.75 |
|
|
|
Between States |
135.02 |
5.35 |
0.000 |
|
Between Schools |
908.27 |
35.99 |
0.000 |
|
Between Students |
1480.46 |
58.66 |
0.000 |
Model 1 show that the students accounted for the largest percentage of unexplained variance in Mathematics achievement, about 59%. Schools contribute with a smaller but also substantial percentage of the variability, approximately 36%. States accounted for a small, nevertheless significant, portion 5,35%.
Table 4: Results of the Hierarchical Liner Model 2
|
|
Estimate |
SD |
P value |
|
Fixed Effects |
|
|
|
|
Intercept |
245.2591 |
2.6695 |
0.000 |
|
Sex |
10.8623 |
0.6156 |
0.000 |
|
Test |
9.1776 |
0.3745 |
0.000 |
|
Regular |
11.4074 |
0.7835 |
0.000 |
|
SES |
5.7711 |
0.5331 |
0.000 |
|
|
Variability |
Percent of Total |
P value |
|
Random Effect |
|
|
|
|
Unexplained Variance |
2401.29 |
|
|
|
Between States |
134.89 |
5.62 |
0.000 |
|
Between Schools |
913.77 |
38.05 |
0.000 |
|
Between Students |
1352.63 |
56.33 |
0.000 |
After the introducing of students’ characteristics, all of them showing a significant effect on mathematics achievement, we observed a reduction in students’ variability of about 9%, while the other variance components remained unchanged.
Several other empirical studies have shown males performing better in mathematics than females. Our data confirmed this fact, showing boys scoring on average 11 points above the girls. Also students, who considered the test easy, got better results. Considering students with differing socioeconomic backgrounds, we also found that students with higher SES performed better. All these results are consistent with the literature. Also, a positive effect of the regularity of school life was observed, as anticipated.
The estimates represent the effect of the variables after controlling for the other variables already in the model. However these variables are interrelated. For example, students with higher socioeconomic backgrounds were more likely to had a adequate school life.
Table 5: Results of the Hierarchical Liner Model 3
|
|
Estimate |
SD |
P value |
|
Fixed Effects |
|
|
|
|
Intercept |
231.3846 |
2.5462 |
0.000 |
|
Sex |
10.8623 |
0.6157 |
0.000 |
|
Test |
9.1776 |
0.3745 |
0.000 |
|
Regular |
11.4074 |
0.7836 |
0.000 |
|
Ses |
5.7711 |
0.5331 |
0.000 |
|
Sector |
54.2105 |
1.7865 |
0.000 |
|
|
Variability |
Percent of Total |
P value |
|
Random Effect |
|
|
|
|
Unexplained Variance |
1826.01 |
|
|
|
Between States |
134.70 |
7.38 |
0.000 |
|
Between Schools |
338.35 |
18.53 |
0.000 |
|
Between Students |
1352.96 |
74.09 |
0.000 |
Model 3 took into account school’s characteristics. As mentioned before, since affiliation were highly associated with the other factors describing schools, it was the only school factor included in the final model. This variable has a huge effect. First private schools students get an extra 55 points in their mean expect achievement. Second, the introduction of this variable in the model diminished the total unexplained variability by about 24% due to the reduction of 67% observed in school variability. The fixed effects coefficients and respective standard deviation, for variables already in model 2, remained unchanged with the addition of the school factor.
DISCUSSION
First it should be note that the intra school process variables account for a sizable share of the variability in the proficiency of 8th grade Brazilian students in Mathematics. The percentage is bigger than the ones observed in similar studies completed in other countries. In other words, there is a lot of opportunities to improve student achievement in Brazil by manipulating schools resources, physical, pedagogical and administrative.
The difference of achievement between public and private schools is so big that even the sampling model and its implementation should be questioned. If true, this difference show a real apartheid in Brazilians schools. The poor and lower middle class that attend public schools are discriminated by being offered a second rate educational service. This will perpetuate the social differences of today's Brazilian society.
The use of more adequate scaling procedures can not compensate for poor questionnaires design. In order to use SAEB to provide schools with policies suggestions, a whole new instrument for collecting students, teachers and principal data should be developed. For this, the synthesis effort made by the school effectiveness literature should be specially useful. However it is not clear whether a large scale endeavor like SAEB is suitable for collecting good quality school process variables.
REFERENCES :
Arroyo et. Al. (1982) Da Escola Carente à Escola Possível. São Paulo: Edições Loyola
Bryk, A. S. and Raudenbush, S.W. (1992): Hierarchical linear models. Newbury Park: Sage.
Crespo, M.; Soares, J.F.; Souza, A.M. (1999) The Brazilian National Evaluation System of Basic Education: Context, Process and Impact. (Paper presented at Annual Meeting of AERA in Montreal, Canada)
Goldstein, H.(1995) Multilevel Statistical Models (2nd Edition). Edward Arnold: London and Halsted Press, New York.
Sammons, P. Thomas, S. Mortimore, P. (1997) Forging Links: Effective Schools and Effective Departments. Paul Chapman Publishing, London.
Scheerens, J. (1992) Effective Schooling: Research, Theory and Practice. Cassel, London.
Rutter, M. and al. (1979) Fifteen Thousand Hours: Secondary Schools and Their Effects on Children. Paul Chapman, London.
Samejima, F. (1969) Estimation of ability using a response pattern of graded scores. Psychometrika Monograph, No. 17
Willms, J.D. (1996) Monitoring School Performance: A Guide for Educators. The Falmer Press, London.